
四、python数据分析股票数据读取和可视化
- 计算机科学
- 2022-07-10
- 207热度
- 0评论
python大数据与机器学习与商业实战
一、数据分析numpy、pandas、matploylib库的使用
9 股票数据读取和可视化
9.1读取股票数据
import tushare as ts #tushare 股价数据相关的库
import tushare as ts
df = ts.get_k_data('000002',start='2009-01-01',end='2019-01-01')
#000002为万科a 本行代码可简写为 df = ts.get_k_data('000002','2009-01-01','2019-01-01')
df
本接口即将停止更新,请尽快使用Pro版接口:https://tushare.pro/document/2
.dataframe tbody tr th:only-of-type { vertical-align: middle; }</body>
.dataframe tbody tr th {
vertical-align: top;
}
.dataframe thead th {
text-align: right;
}
date open close high low volume code 0 2009-01-05 -0.582 -0.462 -0.462 -0.682 936048.88 000002 1 2009-01-06 -0.482 -0.262 -0.212 -0.552 1216831.18 000002 2 2009-01-07 -0.232 -0.302 -0.102 -0.302 834829.31 000002 3 2009-01-08 -0.412 -0.262 -0.162 -0.482 837661.70 000002 4 2009-01-09 -0.262 -0.272 -0.152 -0.352 626815.66 000002 ... ... ... ... ... ... ... ... 2269 2018-12-24 20.608 20.568 20.768 20.018 493219.00 000002 2270 2018-12-25 20.108 20.658 20.908 20.068 426901.00 000002 2271 2018-12-26 20.528 20.488 20.668 20.268 221987.00 000002 2272 2018-12-27 20.938 20.128 21.248 20.128 352501.00 000002 2273 2018-12-28 20.358 20.508 20.928 20.358 322810.00 000002
# data交易日期 open开盘价 close收盘价 high最高价 low最低价 volume成交量 code股票代码
df.to_excel('股价数据.xlsx',index=False)
9.2 绘制走势图
df.set_index('date',inplace=True)
df
.dataframe tbody tr th:only-of-type { vertical-align: middle; }</body>
.dataframe tbody tr th {
vertical-align: top;
}
.dataframe thead th {
text-align: right;
}
open close high low volume code date 2009-01-05 -0.582 -0.462 -0.462 -0.682 936048.88 000002 2009-01-06 -0.482 -0.262 -0.212 -0.552 1216831.18 000002 2009-01-07 -0.232 -0.302 -0.102 -0.302 834829.31 000002 2009-01-08 -0.412 -0.262 -0.162 -0.482 837661.70 000002 2009-01-09 -0.262 -0.272 -0.152 -0.352 626815.66 000002 ... ... ... ... ... ... ... 2018-12-24 20.608 20.568 20.768 20.018 493219.00 000002 2018-12-25 20.108 20.658 20.908 20.068 426901.00 000002 2018-12-26 20.528 20.488 20.668 20.268 221987.00 000002 2018-12-27 20.938 20.128 21.248 20.128 352501.00 000002 2018-12-28 20.358 20.508 20.928 20.358 322810.00 000002
df['close'].plot()
<AxesSubplot:xlabel='date'>

import matplotlib.pyplot as plt
plt.rcParams['font.sans-serif']=['SimHei']
df['close'].plot(title='万科股价走势图')
<AxesSubplot:title={'center':'万科股价走势图'}, xlabel='date'>

9.3 直接使用Matplotlib库绘制图表
import tushare as ts
df = ts.get_k_data('000002',start='2009-01-01',end='2019-01-01')
#调整日期格式,使得横坐标更加清晰美观,将日期转化为时间戳格式
from datetime import datetime
df['date']=df['date'].apply(lambda x:datetime.strptime(x,'%Y-%m-%d'))
plt.plot(df['date'],df['close'])
plt.show()
本接口即将停止更新,请尽快使用Pro版接口:https://tushare.pro/document/2

9.2
# 安装K线图的mpl_finance库
!pip install https://github.com/matplotlib/mpl_finance/archive/master.zip
Collecting https://github.com/matplotlib/mpl_finance/archive/master.zip
Downloading https://github.com/matplotlib/mpl_finance/archive/master.zip
Requirement already satisfied: matplotlib in e:\assembly language\anaconda\soft\lib\site-packages (from mpl-finance==0.10.1) (3.3.4)
Requirement already satisfied: python-dateutil>=2.1 in e:\assembly language\anaconda\soft\lib\site-packages (from matplotlib->mpl-finance==0.10.1) (2.8.1)
Requirement already satisfied: numpy>=1.15 in e:\assembly language\anaconda\soft\lib\site-packages (from matplotlib->mpl-finance==0.10.1) (1.20.1)
Requirement already satisfied: kiwisolver>=1.0.1 in e:\assembly language\anaconda\soft\lib\site-packages (from matplotlib->mpl-finance==0.10.1) (1.3.1)
Requirement already satisfied: pyparsing!=2.0.4,!=2.1.2,!=2.1.6,>=2.0.3 in e:\assembly language\anaconda\soft\lib\site-packages (from matplotlib->mpl-finance==0.10.1) (2.4.7)
Requirement already satisfied: pillow>=6.2.0 in e:\assembly language\anaconda\soft\lib\site-packages (from matplotlib->mpl-finance==0.10.1) (8.2.0)
Requirement already satisfied: cycler>=0.10 in e:\assembly language\anaconda\soft\lib\site-packages (from matplotlib->mpl-finance==0.10.1) (0.10.0)
Requirement already satisfied: six in e:\assembly language\anaconda\soft\lib\site-packages (from cycler>=0.10->matplotlib->mpl-finance==0.10.1) (1.15.0)
Building wheels for collected packages: mpl-finance
Building wheel for mpl-finance (setup.py): started
Building wheel for mpl-finance (setup.py): finished with status 'done'
Created wheel for mpl-finance: filename=mpl_finance-0.10.1-py3-none-any.whl size=8423 sha256=2291550ceee6603015e491473cff1334234e16a47b7d66dbd039051f2bb85819
Stored in directory: C:\Users\WCY\AppData\Local\Temp\pip-ephem-wheel-cache-sw6fb4sv\wheels\e5\79\d7\03ee900b85115c0e28de92b75e95d4ac278274277a16d04e68
Successfully built mpl-finance
Installing collected packages: mpl-finance
Successfully installed mpl-finance-0.10.1
!pip install --upgrade mplfinance #升级一下库
Collecting mplfinance
Downloading mplfinance-0.12.9b1-py3-none-any.whl (70 kB)
Requirement already satisfied: matplotlib in e:\assembly language\anaconda\soft\lib\site-packages (from mplfinance) (3.3.4)
Requirement already satisfied: pandas in e:\assembly language\anaconda\soft\lib\site-packages (from mplfinance) (1.2.4)
Requirement already satisfied: pyparsing!=2.0.4,!=2.1.2,!=2.1.6,>=2.0.3 in e:\assembly language\anaconda\soft\lib\site-packages (from matplotlib->mplfinance) (2.4.7)
Requirement already satisfied: cycler>=0.10 in e:\assembly language\anaconda\soft\lib\site-packages (from matplotlib->mplfinance) (0.10.0)
Requirement already satisfied: pillow>=6.2.0 in e:\assembly language\anaconda\soft\lib\site-packages (from matplotlib->mplfinance) (8.2.0)
Requirement already satisfied: numpy>=1.15 in e:\assembly language\anaconda\soft\lib\site-packages (from matplotlib->mplfinance) (1.20.1)
Requirement already satisfied: kiwisolver>=1.0.1 in e:\assembly language\anaconda\soft\lib\site-packages (from matplotlib->mplfinance) (1.3.1)
Requirement already satisfied: python-dateutil>=2.1 in e:\assembly language\anaconda\soft\lib\site-packages (from matplotlib->mplfinance) (2.8.1)
Requirement already satisfied: six in e:\assembly language\anaconda\soft\lib\site-packages (from cycler>=0.10->matplotlib->mplfinance) (1.15.0)
Requirement already satisfied: pytz>=2017.3 in e:\assembly language\anaconda\soft\lib\site-packages (from pandas->mplfinance) (2021.1)
Installing collected packages: mplfinance
Successfully installed mplfinance-0.12.9b1
import tushare as ts
import matplotlib.pyplot as plt
import mpl_finance as mpf
import seaborn as sns # seaborn是一个图表美化库
from matplotlib.pylab import date2num # 调整日期格式的两个库
import datetime
sns.set()
df = ts.get_k_data('000002','2019-06-01','2019-09-30')
def date_to_sum(dates): #转换日期函数
num_time = []
for date in dates:
date_time = datetime.datetime.strptime(date,'%Y-%m-%d')
num_date = date2num(date_time) #date2num()将时间戳格式转换为数字格式
num_time.append(num_date)
return num_time
df_arr = df.values #将DataFrame格式转换为二维数组
df_arr[:,0]=date_to_sum(df_arr[:,0]) #将二维数组中的日期转换为数字格式
df_arr[0:5]
本接口即将停止更新,请尽快使用Pro版接口:https://tushare.pro/document/2
array([[18050.0, 23.498, 23.128, 23.708, 22.968, 317567.0, '000002'],
[18051.0, 23.158, 22.988, 23.228, 22.938, 203260.0, '000002'],
[18052.0, 23.328, 23.718, 23.968, 23.318, 576164.0, '000002'],
[18053.0, 23.698, 23.808, 23.978, 23.608, 333792.0, '000002'],
[18057.0, 23.978, 24.498, 24.738, 23.858, 527547.0, '000002']],
dtype=object)
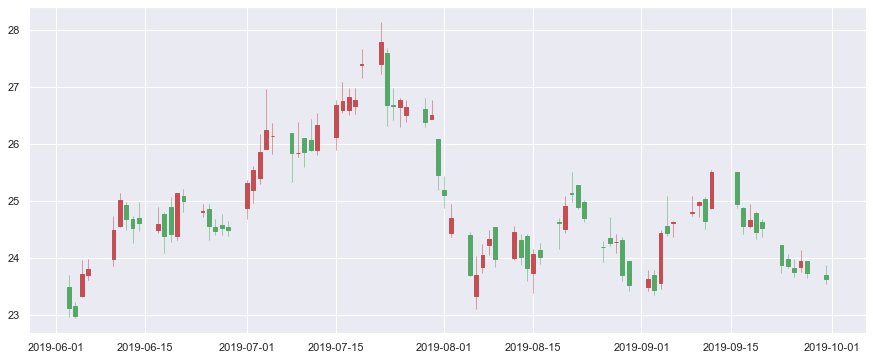
fig,ax =plt.subplots(figsize=(15,6)) # 创建画布
mpf.candlestick_ochl(ax,df_arr,width=0.6,colorup='r',colordown='g',alpha=1)
plt.grid(True) # 显示网格线
ax.xaxis_date() #设置x轴刻度为常规日期格式
plt.rcParams['font.sans-serif']=['SimHei']
df['MA5'] = df['close'].rolling(5).mean() # roll 与 mean直接算出均线数据
df['MA10'] = df['close'].rolling(10).mean()
fig,ax =plt.subplots(figsize=(15,6))
mpf.candlestick_ochl(ax,df_arr,width=0.6,colorup='r',colordown='g',alpha=1)
#ax 画布中的子布,df_arr股价历史数据,width K线柱形的宽度,
#colorup/dowm高于或低于开盘价柱形颜色,alpha柱形颜色的透明度
# 绘制K线图
plt.plot(df_arr[:,0],df['MA5'])
plt.plot(df_arr[:,0],df['MA10'])
plt.grid(True) 绘制网格线
plt.title('万科A')
plt.xlabel('日期')
plt.ylabel('价格')# 设置x轴的格式为正常
ax.xaxis_date()

fig,axes = plt.subplots(2,1,sharex=True,figsize=(15,8))
ax1,ax2 = axes.flatten()
mpf.candlestick_ochl(ax1,df_arr,width=0.6,colorup='r',colordown='g',alpha=1)
ax1.plot(df_arr[:,0],df['MA5'])
ax2.plot(df_arr[:,0],df['MA10'])
ax1.set_title('万科')
ax1.set_ylabel('价格')
ax1.grid(True)
ax1.xaxis_date()
ax2.bar(df_arr[:,0],df_arr[:,5])
ax2.set_xlabel('日期')
ax2.set_ylabel('成交量')
ax2.grid(True)
ax2.xaxis_date()

