
PPT&sound mark&speech draft
- 外语
- 2023-03-29
- 255热度
- 0评论


nonlinearity /nɑːnlɪniˈærəti/
behaviours /bɪˈheɪvjər/
influential /ˌɪnfluˈenʃ(ə)l/
imported /ɪmˈpɔːrtɪd/
presents /ˈprez(ə)nts/
reproduce /ˌriːprəˈduːs/
Peepholes /ˈpiːphoʊl/
Recommended /ˌrekəˈmendɪd/
simplified /ˈsɪmplɪfaɪd/
generates /ˈdʒenəreɪts
width /wɪdθ/
modelling /ˈmɑːdəlɪŋ/
procedure /prəˈsiːdʒər/
predominantly /prɪˈdɑːmɪnəntli/
data /ˈdeɪtə/
optimization /ˌɑːptɪməˈzeɪʃn/
identical /aɪˈdentɪk(ə)l/
convergence /kənˈvɜːrdʒəns/
precision /prɪˈsɪʒ(ə)n/
visualizes /ˈvɪʒʊəˌlaɪz; -zjʊ-/
normalized /'nɔ:məlaiz/
tabulates /ˈtæbjuleɪt/
statistical /stəˈtɪstɪk(ə)l/
robustness /roʊˈbʌstnəs/
indices /ˈɪndɪsiːz/
superiority /suːˌpɪriˈɔːrəti/
coefficients /ˌkoʊɪˈfɪʃ(ə)nt/
determination /dɪˌtɜːrmɪˈneɪʃ(ə)n/
loose /luːs/
exhibits /ɪɡˈzɪbɪt/
generalize /ˈdʒen(ə)rəlaɪz/
parameters /pəˈræmɪtərz/
tabulated /ˈtæbjuleɪtɪd/
exhibited /ɪɡˈzɪbɪtɪd/
softening /ˈsɔːfn
fluctuation /ˌflʌktʃuˈeɪʃn/
numerical /nuːˈmerɪk(ə)l/
bias /ˈbaɪəs/
outperformed /ˌaʊtpərˈfɔːrm/
precision /prɪˈsɪʒ(ə)n/
convergence /kənˈvɜːrdʒəns/
1
Good morning everyone, my name is wang chiyu. I’m from northeastern university. And then I will introduce this paper to you.
2
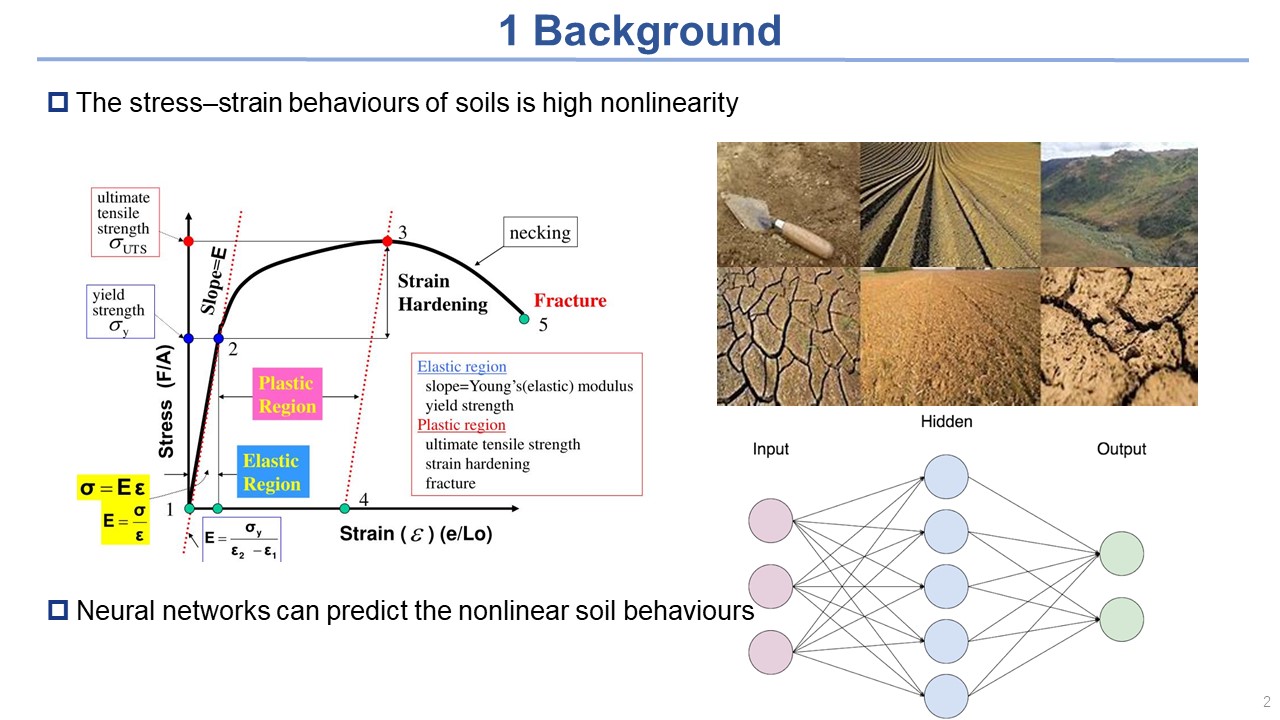
As we all know that the stress–strain behaviours of soils are high nonlinearity. And the traditional models are difficult to determine.
One the other hand, Neural networks can predict the nonlinear soil behaviours under different conditions.
This paper presents a new application of the LSTM model to reproduce the soil’s stress–strain behaviours.
3
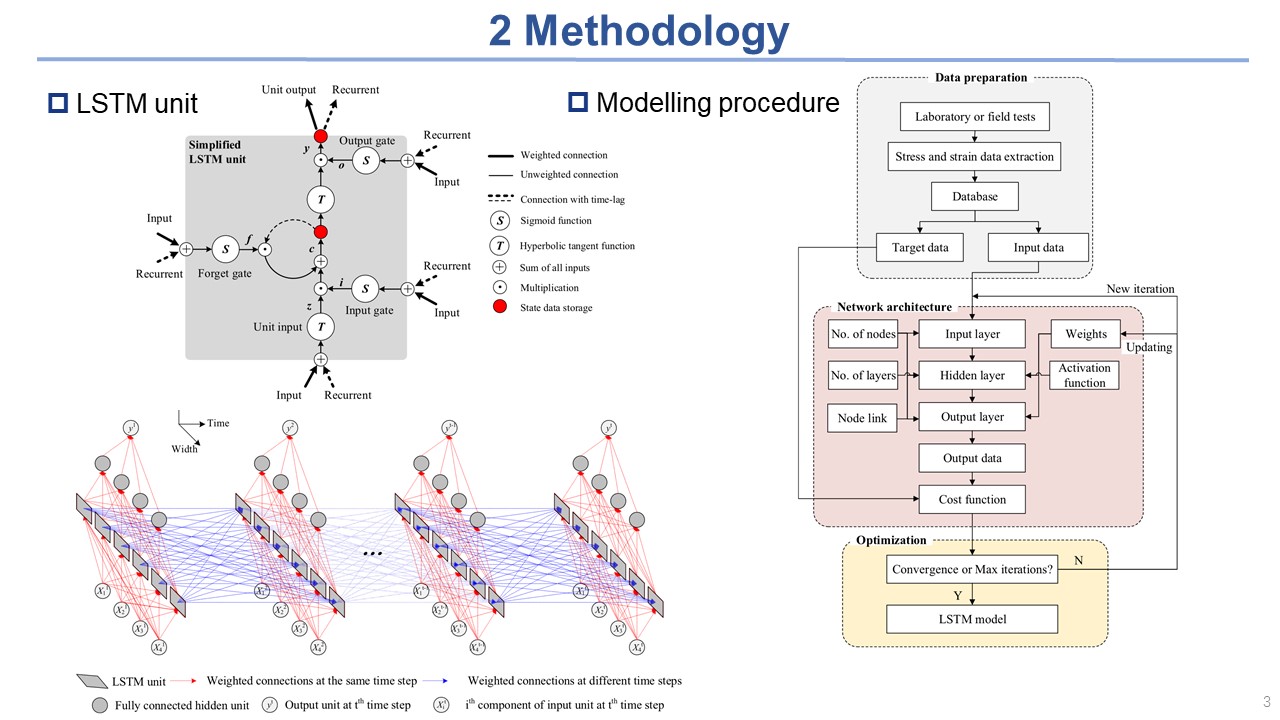
Figure 1 presents the simplified LSTM units to reduce the computational cost
Figure 2 shows the architecture of an LSTM model with three-dimensional network along the height, width, and time dimensions.
Figure 3 shows the three steps of modelling procedure: the preparation of data, the network architectures, and the optimisation.
4
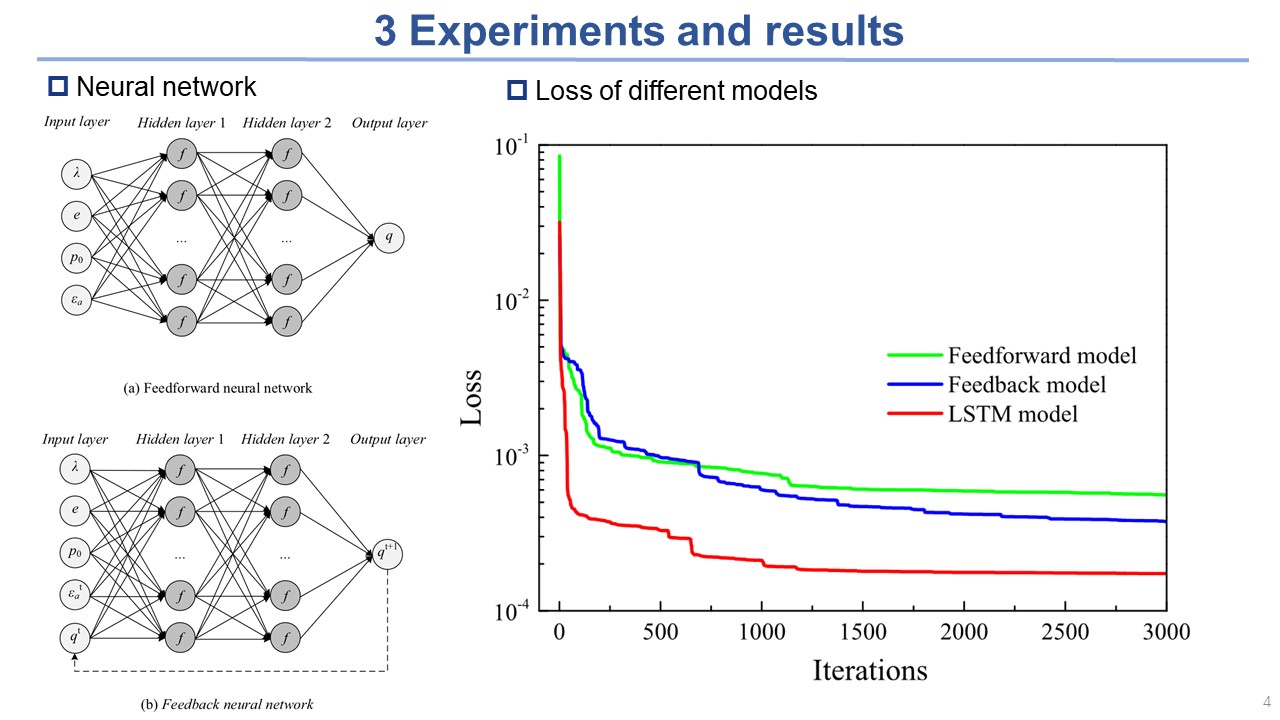
This is the architectures of the two neural networks (a) feedforward neural network and (b) feedback neural network.
These three models were identical to ensure the correct results.
Figure shows the loss of the different models in the training process.
We can see that the LSTM model outperformed the feedforward and feedback models both on the convergence rate and the precision.
5
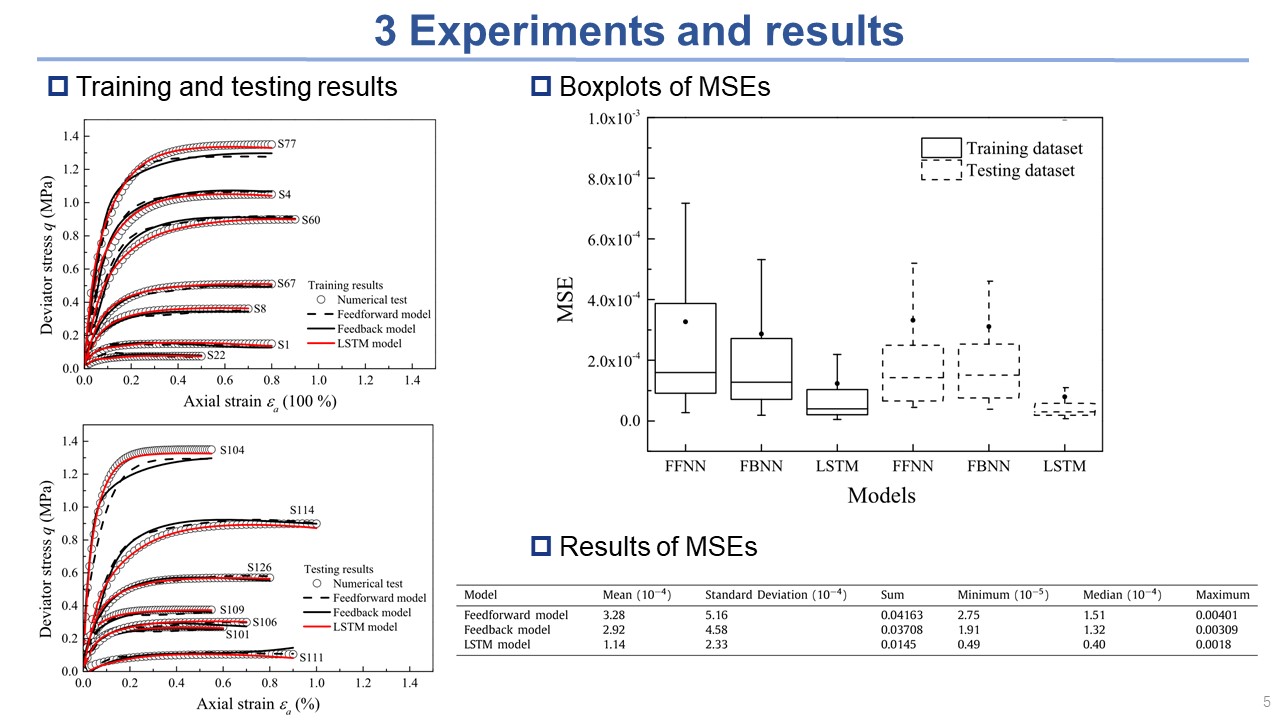
Figure shows the training results and the testing results of the different models.
Both the training and testing results indicate that the LSTM model was more effective than the other two models.
This Boxplots visualises the MSEs and the table is the results of the tests for the MSEs.
It confirms the excellent robustness of the LSTM model.
6
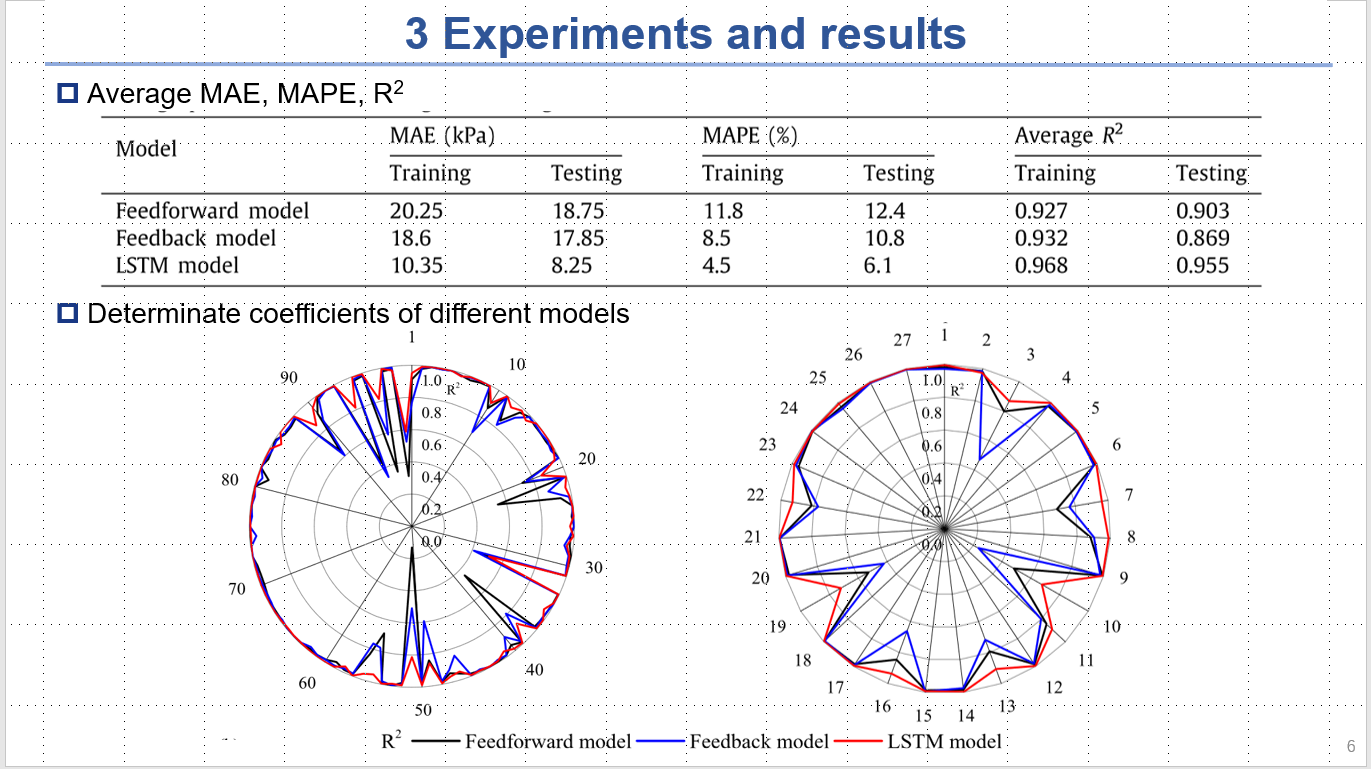
Table presents the average MAE, MAPE and R2 of different models.
We can see the superiority of the LSTM model. It had higher precision and smaller errors.
Figure compares the coefficients of determination of each sample from different models.
Clearly the LSTM model outperformed the other two models for all the training and testing samples.
7
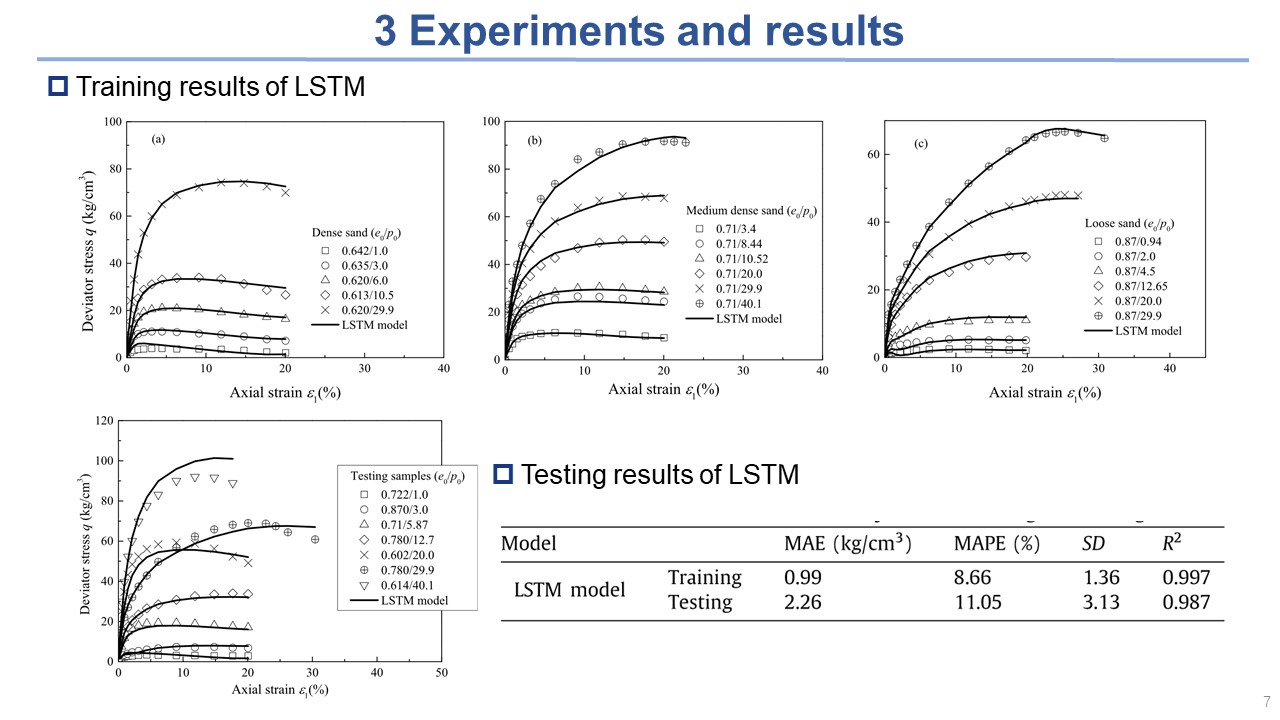
Figure presents the training results of the LSTM model.
It well represented the strain softening behavior of dense sand and loose sand.
It closely agreement with the measured stresses and strains.
This figure shows the excellent performance of test samples. It indicates that the LSTM model can predict the stress-strain behaviour of the sand with unknown parameters.
The numerical results of the LSTM model are in Table.
8
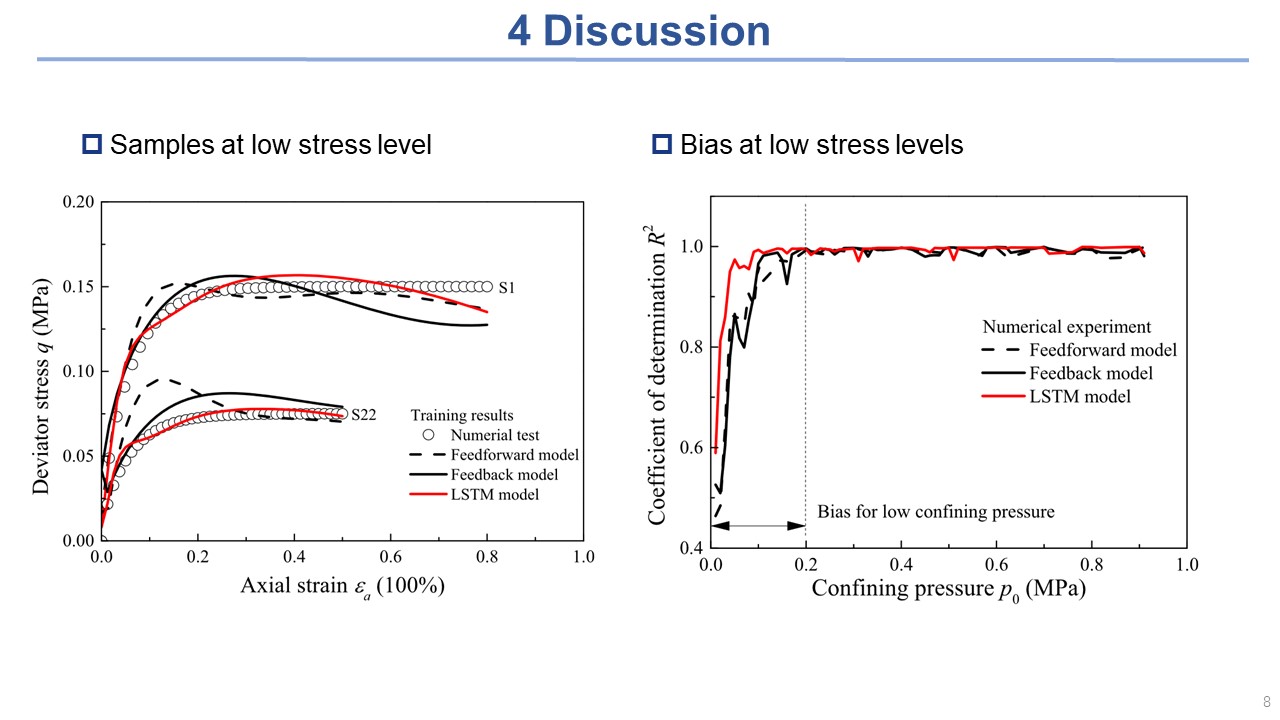
The figure presents the training results of different models at low stress levels
Although the LSTM model have better training performance than the other two neural-network models. Both the training and testing results exhibited large biases at low stress levels.
And the coefficients of determination in the numerical experiment.
It conclude that the bias at low stress levels is a common problem for all the three models
9
This study presents an LSTM deep-learning method to model the stress–strain behaviour of soils. These are the conclusions.
- A new approach for modelling the stress–strain behaviours using the LSTM deep-learning method was proposed.
- The LSTM model outperformed the feed forward and feedback models both in the precision and convergence rate.
- The excellent performance of the LSTM model on the measured stress–strain behaviours of soils.
- Biases at low stress levels are still a common problem for these models.
10
That is all my presentation, thank you for your listening.
Ok Thank you. That is a good question. I think your question is about the difference between the LSTM deep-learning network and other neural networks.
The difference is the LSTM has temporal links among the hidden layer. The typical LSTM unit is usually composed of an input gate, an output gate, a forget gate, a unit input, a cell state, and peepholes. And we used a simplified LSTM unit without peepholes to reduce the computational cost.
Did that answer your question?
